Skip to content
Main Navigation Puget Systems Logo
  • Solutions
    • Content Creation
      • Photo Editing
        • Recommended Systems For:
        • Adobe Lightroom Classic
        • Adobe Photoshop
        • Stable Diffusion
      • Video Editing & Motion Graphics
        • Recommended Systems For:
        • Adobe After Effects
        • Adobe Premiere Pro
        • DaVinci Resolve
        • Foundry Nuke
      • 3D Design & Animation
        • Recommended Systems For:
        • Autodesk 3ds Max
        • Autodesk Maya
        • Blender
        • Cinema 4D
        • Houdini
        • ZBrush
      • Real-Time Engines
        • Recommended Systems For:
        • Game Development
        • Unity
        • Unreal Engine
        • Virtual Production
      • Rendering
        • Recommended Systems For:
        • Keyshot
        • OctaneRender
        • Redshift
        • V-Ray
      • Digital Audio
        • Recommended Systems For:
        • Ableton Live
        • FL Studio
        • Pro Tools
    • Engineering
      • Architecture & CAD
        • Recommended Systems For:
        • Autodesk AutoCAD
        • Autodesk Inventor
        • Autodesk Revit
        • SOLIDWORKS
      • Visualization
        • Recommended Systems For:
        • Enscape
        • Lumion
        • Twinmotion
      • Photogrammetry & GIS
        • Recommended Systems For:
        • ArcGIS Pro
        • Agisoft Metashape
        • Pix4D
        • RealityCapture
    • AI & HPC
      • Recommended Systems For:
      • Data Science
      • Generative AI
      • Large Language Models
      • Machine Learning / AI Dev
      • Scientific Computing
    • More
      • Recommended Systems For:
      • Compact Size
      • Live Streaming
      • NVIDIA RTX Studio
      • Quiet Operation
      • Virtual Reality
    • Business & Enterprise
      We can empower your company
    • Government & Education
      Services tailored for your organization
  • Products
    • Puget Mobile
      Powerful laptop workstations
      • Puget Mobile 16″
    • Puget Workstations
      High-performance desktop PCs
      • AMD Ryzen
        • Ryzen 9000:
        • Small Form Factor
        • Mini Tower
        • Mid Tower
        • Full Tower
      • AMD Threadripper
        • Threadripper 7000:
        • Mid Tower
        • Full Tower
        • Threadripper PRO 7000WX:
        • Full Tower
      • AMD EPYC
        • EPYC 9004:
        • Full Tower
      • Intel Core Ultra
        • Core Ultra Series 2:
        • Small Form Factor
        • Mini Tower
        • Mid Tower
        • Full Tower
      • Intel Xeon
        • Xeon W-2500:
        • Mid Tower
        • Xeon W-3500:
        • Full Tower
    • Custom Computers
    • Puget Rackstations
      Workstations in rackmount chassis
      • AMD Rackstations
        • Ryzen 7000 / EPYC 4004:
        • R550-6U 5-Node
        • Ryzen 9000:
        • R132-4U
        • Threadripper 7000:
        • T121-4U
        • Threadripper PRO 7000WX:
        • T141-4U
        • T140-5U (Dual 5090s)
      • Intel Rackstations
        • Core Ultra Series 2:
        • C132-4U
        • Xeon W-3500:
        • X131-4U
        • X141-5U
    • Custom Rackmount Workstations
    • Puget Servers
      Enterprise-class rackmount servers
      • Rackmount Servers
        • AMD EPYC:
        • E200-1U
        • E140-2U
        • E280-4U
        • Intel Xeon:
        • X200-1U
    • Comino Grando GPU Servers
    • Custom Servers
    • Puget Storage
      Solutions from desktop to datacenter
      • Network-Attached Storage
        • Synology NAS Units:
        • 4-bay DiskStation
        • 8-bay DiskStation
        • 12-bay DiskStation
        • 4-bay RackStation
        • 12-bay FlashStation
      • Software-Defined Storage
        • Datacenter Storage:
        • 12-Bay 2U
        • 24-Bay 2U
        • 36-Bay 4U
    • Recommended Third Party Peripherals
      Curated list of accessories for your workstation
    • Puget Gear
      Quality apparel with Puget Systems branding
  • Publications
    • Articles
    • Blog Posts
    • Case Studies
    • HPC Blog
    • Podcasts
    • Press
    • PugetBench
  • Support
    • Contact Support
    • Support Articles
    • Warranty Details
    • Onsite Services
    • Unboxing
  • About Us
    • About Us
    • Contact Us
    • Our Customers
    • Enterprise
    • Gov & Edu
    • Press Kit
    • Testimonials
    • Careers
  • Talk to an Expert
  • My Account
  1. Home
  2. /
  3. Hardware Articles
  4. /
  5. Impact of DDR5 Speed on Content Creation Performance (2023 update)

Impact of DDR5 Speed on Content Creation Performance (2023 update)

Posted on June 7, 2023 (July 7, 2023) by Evan Lagergren
Always look at the date when you read an article. Some of the content in this article is most likely out of date, as it was written on June 7, 2023. For newer information, see our more recent articles.

Table of Contents

  • Introduction
  • Test Setup
  • Photography
  • Video Editing and Motion Graphics
  • Game Development and Virtual Production
  • Rendering
  • Overall Performance
  • How Does DDR5 Memory Speed Affect Content Creation Performance?

TL;DR: DDR5 memory speed impact on content creation

Based on an overall weighted geometric mean of normalized performance scores, the “fastest” memory configurations for both the Intel i9-13900K and AMD Ryzen 9 7950X test platforms resulted in a maximum performance increase of 4% and 7%, respectively, compared to those systems running with at their maximum supported memory frequency with JEDEC timing. The most affected application was Unreal Engine (specifically performing Shader Compilation), with a total performance difference of about 12% for both platforms.

Although many of these results are statistically significant, they are small enough that, for content creation, you are likely better off sticking to the supported memory frequencies and default timings for professional use due to stability and warranty reasons.

Introduction

One policy that frequently sets us apart from other system integrators and reviewers is using non-overclocked JEDEC specification memory (RAM) and not running that RAM beyond the maximum supported memory frequency on any given CPU. We do this because, as a workstation manufacturer, we prioritize system stability and reliability over a relatively small performance gain. Our current product line means that our two desktop DDR5-enabled platforms – AMD’s X670 and Intel’s Z790 – have an official maximum speed of 5200 Mbps and 5600 Mbps, respectively. This is further decreased when running multi-rank DIMMs (RAM Sticks) or more than two DIMMs. 

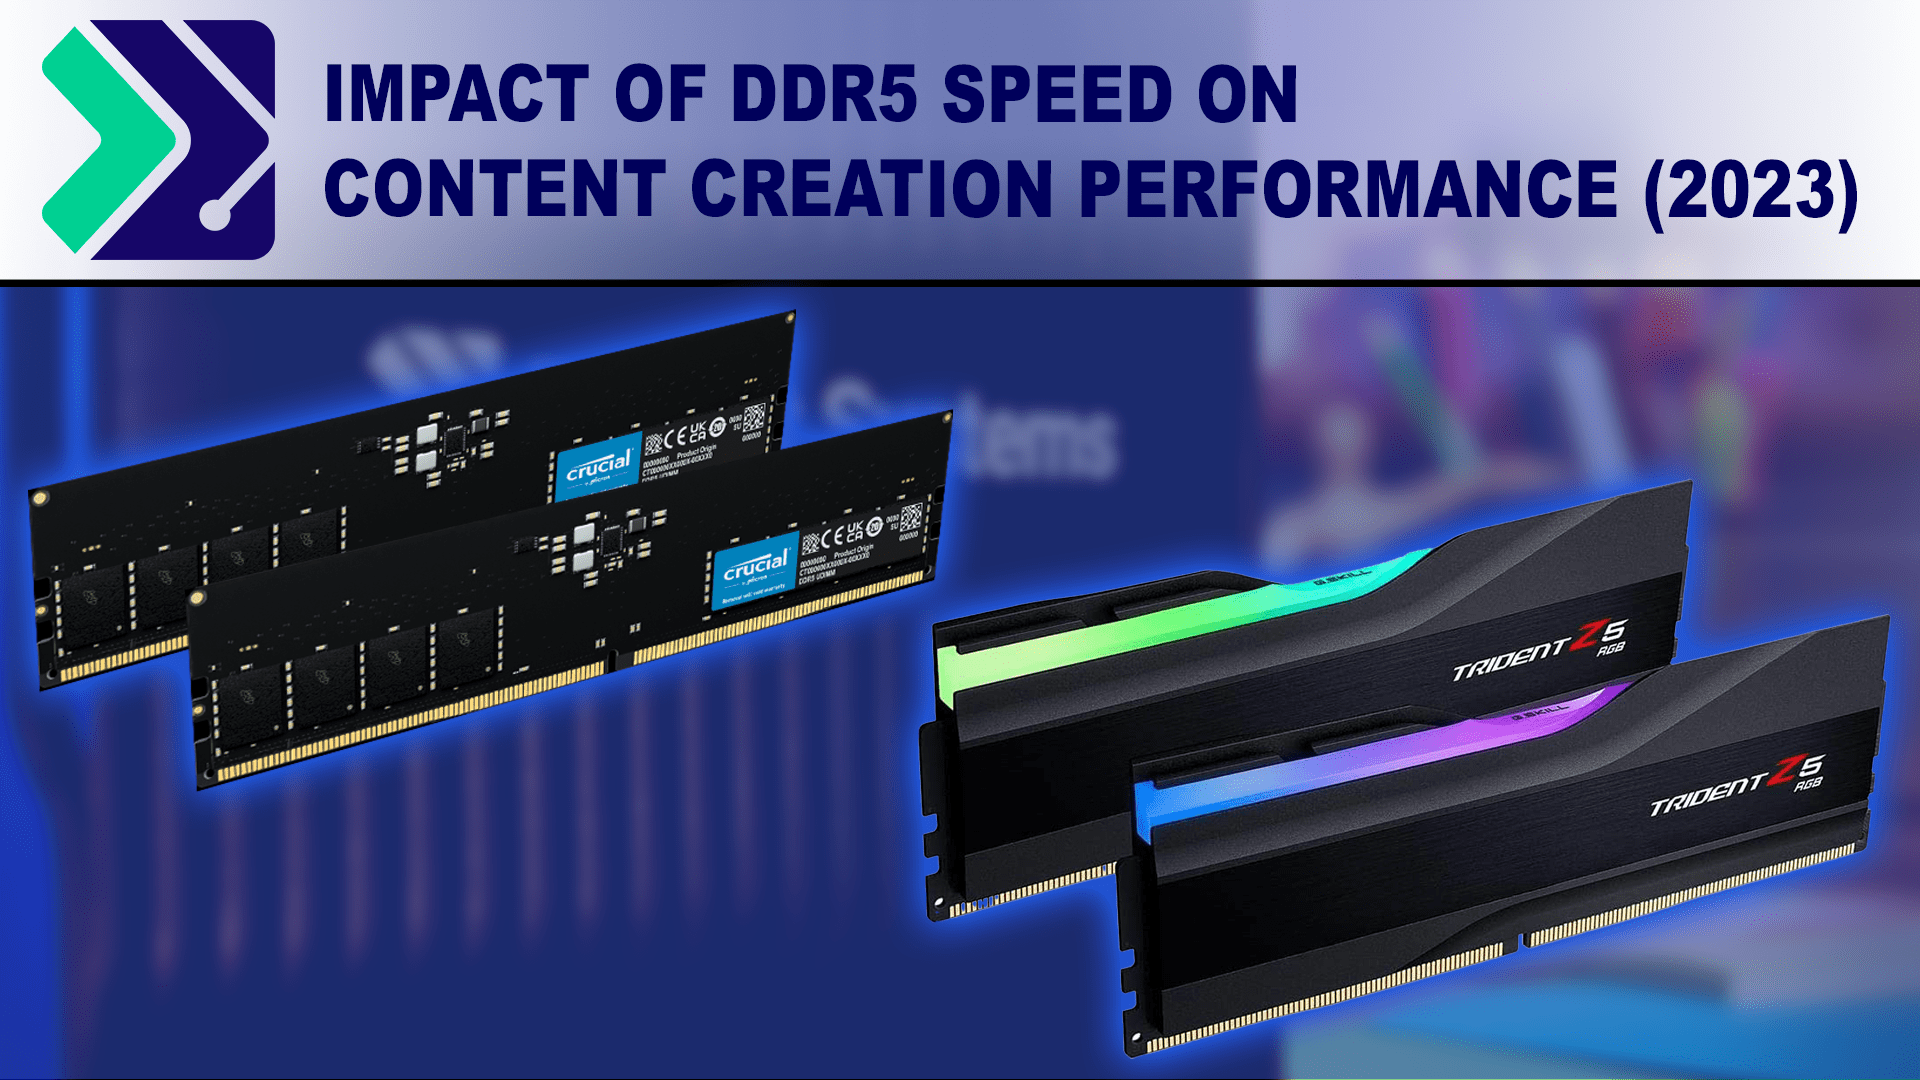
However, we are constantly evaluating our product line to ensure that we are offering our customers the best possible experience, and part of that means testing how the frequency of RAM affects performance in content creation applications. In this article, we are investigating performance across various RAM speeds from 4400 Mbps to 6400 Mbps. Most of these will be run at JEDEC-specified sub-timings (at the “B” specification as that is what our current RAM conforms to with two DIMMs installed), with the addition of a 6400 kit run using XMP on Intel and at 6000 Mbps with manually configured sub-timings on AMD.

Memory speed is discussed in various ways, most popularly in megahertz (MHz). Many manufacturers have transitioned away from MHz as, due to the nature of DDR (double-data rate) RAM, the MHz quoted was an effective or equivalent MHz, not the actual DRAM frequency (e.g. a 5600 kit runs at 2800 MHz). Most popularly, the change has been to start quoting speeds in megatransfers per second (Mt/s). This accounts for DDR (Double Data Rate) Memory making two transfers per cycle such that the speed in Mt/s is equal to the “effective/equivalent clock rate” of the memory. Some vendors have also begun dropping any units from their kits, advertising them as, for example, DDR5 5600. When discussing a particular memory kit, we will follow this convention. The final way that some manufacturers discuss memory speed is in Megabits per second (Mbps). However, this should not be confused with overall memory bandwidth as that requires knowing the memory speed in Mbps and the data bus width of your configuration (64-bits per channel). We will be referring to actual speeds in Mbps.
DDR5 Speed revisit
Image
Open Full Resolution

Test Setup

AMD Ryzen 9 Test Platform

CPU: AMD Ryzen 9 7950X 16-core
CPU Cooler: Noctua NH-U12A
Motherboard: ASUS ProArt X670E-Creator WiFi
RAM:
2x DDR5-5600 32GB (64 GB total)
2x G.SKILL Trident Z5 DDR5-6400 32GB (64 GB total)
GPU: NVIDIA GeForce RTX 4080 16GB
PSU: Super Flower LEADEX Platinum 1600W
Storage: Samsung 980 Pro 2TB
OS: Windows 11 Pro 64-bit (22621)

Intel Core i9 Test Platform

CPU: Intel Core i9-13900K 24-core
CPU Cooler: Noctua NH-U12A
Motherboard: ASUS ProArt Z690-Creator WiFi
RAM:
2x DDR5-5600 32GB (64 GB total)
2x G.SKILL Trident Z5 DDR5-6400 32GB (64 GB total)
GPU: NVIDIA GeForce RTX 4080 16GB
PSU: Super Flower LEADEX Platinum 1600W
Storage: Samsung 980 Pro 2TB
OS: Windows 11 Pro 64-bit (22621)

Benchmark Software

Photoshop 24.1.1 – PugetBench for Photoshop 0.93.6
Lightroom Classic 12.3 – PugetBench for Lightroom Classic 0.94
After Effects 23.3 – PugetBench for After Effects 0.95.6
Premiere Pro 23.4.0 – PugetBench for Premiere Pro 0.95.6
DaVinci Resolve 18.1.4 – PugetBench for DaVinci Resolve 0.93.2
Unreal Engine 4.26
Unreal Engine 5.1
Cinebench R23.2
Blender 3.4.0
V-Ray 5.02.00

To investigate the effects of memory frequency on content creation workflows, we will be testing with both Intel and AMD desktop platforms – the Intel i9-13900k and AMD Ryzen 9 7950X. Both of these will be tested with 2×32 GB of RAM for a total of 64 GB.

We are using two different kits of RAM for this testing. The first is the standard set we use in our workstations, two DDR5 5600 32 GB DIMMs which run at the JEDEC B specification of 46-46-46. The second is a G.Skill Trident Z5 6400 32 GB DIMM kit with 2 DIMMs for a total of 64 GB, with an Intel XMP profile for 6400 Mbps 32-39-39-102. We will test memory speeds from 4400 to 6000 at JEDEC B timings by manually setting frequency and timings in BIOS. For speeds between 4400 and 5600 Mbps, both systems were tested using the 5600 DIMMs, and for 6000+ Mbps, the 6400 kit. Due to stability issues, the AMD platform could not complete our benchmark runs at 6400 Mbps, so instead, a more optimized set of timings from Buildzoid at 6000 Mbps was used.

For this article, we will follow most of our standard procedure for benchmarking: testing CPUs following Intel’s and AMD’s official guidance (with, of course, one major exception). This means that “overclocking” features such as MCE and PBO will be disabled, and power limits will be enforced. However, we will allow the processors to operate outside standard maximum memory speed and maximum memory voltage requirements.

Testing will be performed with our standard content creation suite, featuring Puget Systems Benchmarks on their most recent versions. We will also include results from several other benchmarks, including CPU rendering engines like V-Ray and Octane and game development benchmarks in Unreal Engine. If you want to know how your system stacks up, our PugetBench applications are available for download.

Tower Computer Icon in Puget Systems Colors

Looking for a Content Creation Workstation?

We build computers tailor-made for your workflow. 

Configure a System!
Talking Head Icon in Puget Systems Colors

Don’t know where to start?
We can help!

Get in touch with our technical consultants today.

Talk to an Expert

Photography

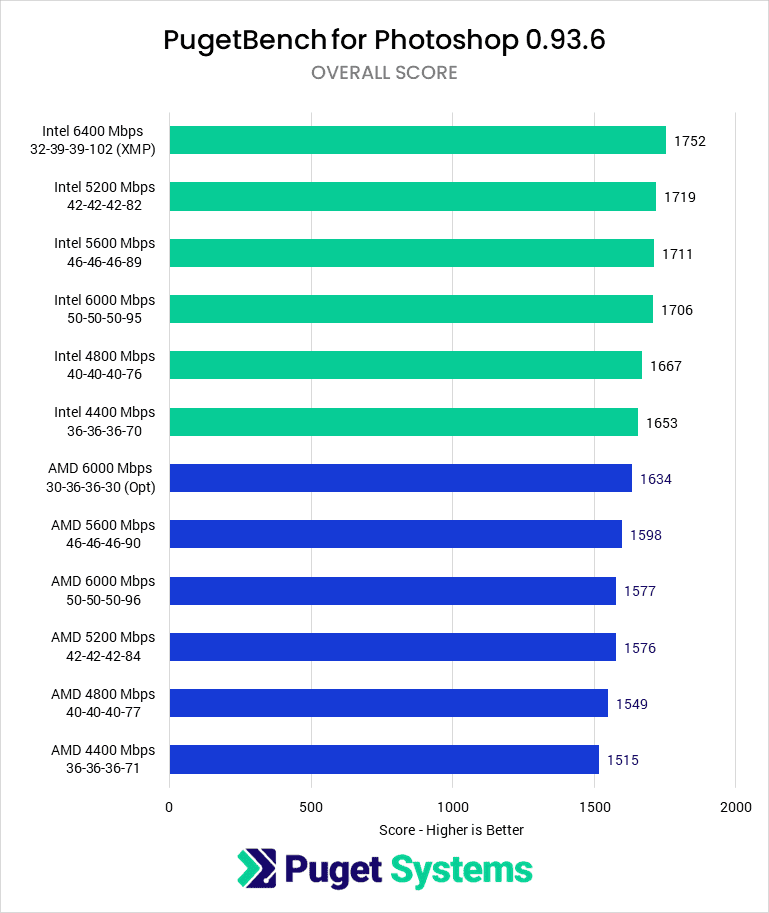
Photoshop Overall Score - Higher is Better. Intel 6400 (XMP): 1752; Intel 5200: 1719; Intel 5600: 1711; Intel 6000: 1706; Intel 4800: 1667; Intel 4400: 1653; AMD 6000 (Optimized): 1634; AMD 5600: 1598; AMD 6000 (JEDEC): 1577; AMD 5200: 1576; AMD 4800: 1549; AMD 4400: 1515
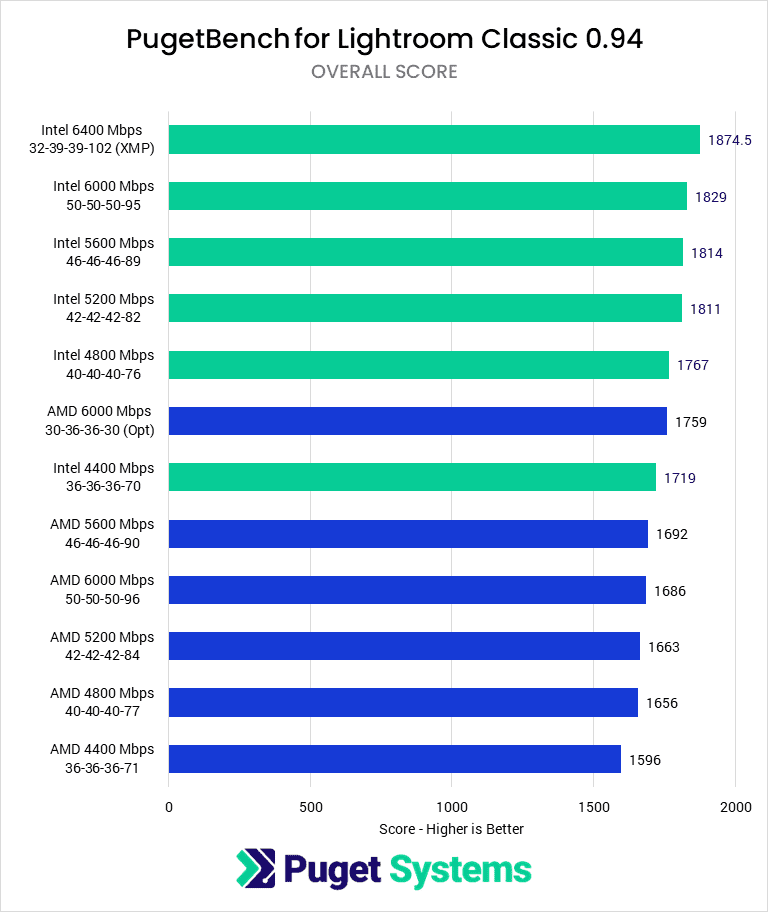
Lightroom Classic Overall Score - Higher is Better. Intel 6400 (XMP): 1874.5; Intel 6000: 1829; Intel 5600: 1814; Intel 5200: 1811; Intel 4800: 1767; AMD 6000 (Optimized): 1759; Intel 4400: 1719; AMD 5600: 1692; AMD 6000 (JEDEC): 1686; AMD 5200: 1663; AMD 4800: 1656; AMD 4400: 1596
Previous Next
System Image
Photoshop Overall Score - Higher is Better. Intel 6400 (XMP): 1752; Intel 5200: 1719; Intel 5600: 1711; Intel 6000: 1706; Intel 4800: 1667; Intel 4400: 1653; AMD 6000 (Optimized): 1634; AMD 5600: 1598; AMD 6000 (JEDEC): 1577; AMD 5200: 1576; AMD 4800: 1549; AMD 4400: 1515
Open Full Resolution
Lightroom Classic Overall Score - Higher is Better. Intel 6400 (XMP): 1874.5; Intel 6000: 1829; Intel 5600: 1814; Intel 5200: 1811; Intel 4800: 1767; AMD 6000 (Optimized): 1759; Intel 4400: 1719; AMD 5600: 1692; AMD 6000 (JEDEC): 1686; AMD 5200: 1663; AMD 4800: 1656; AMD 4400: 1596
Open Full Resolution
Previous Next

In photography applications like Adobe Photoshop and Lightroom Classic, we see a fairly consistent increase in performance with higher memory frequencies. For the Intel system, it is interesting to note that, overall, the tests ran at 5200, 5600, and 6000 Mbps all scored essentially the same, with the slower speed tests scoring a few percent lower per 400 Mbps drop. Similarly, the 6400 Mbps XMP tests gained an additional 3% performance.

AMD has largely the same behavior, with the 5200-6000 Mbps JEDEC tests having nearly identical scores and only speeds lower than the official maximum performing worse. However, the 6000 Mbps optimized timings runs had a 5% uplift in performance, likely due to the lower latency from the tighter timings. In the future, it may be interesting to examine if the higher scores from the Intel XMP profile are due primarily to the increase in speed or the decrease in latency from the lower timings.

Video Editing and Motion Graphics

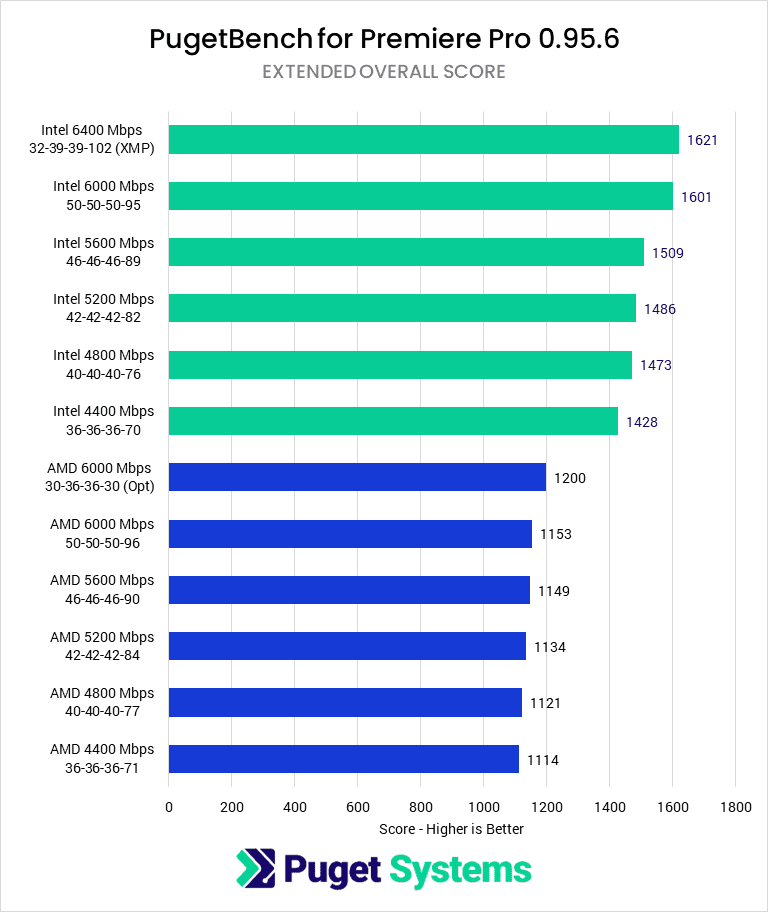
Premiere Pro Extended Overall Score - Higher is Better. Intel 6400 (XMP): 1621; Intel 6000: 1601; Intel 5600: 1509; Intel 5200: 1486; Intel 4800: 1473; Intel 4400: 1428; AMD 6000 (Optimized): 1200; AMD 6000 (JEDEC): 1153; AMD 5600: 1149; AMD 5200: 1134; AMD 4800: 1121; AMD 4400: 1114
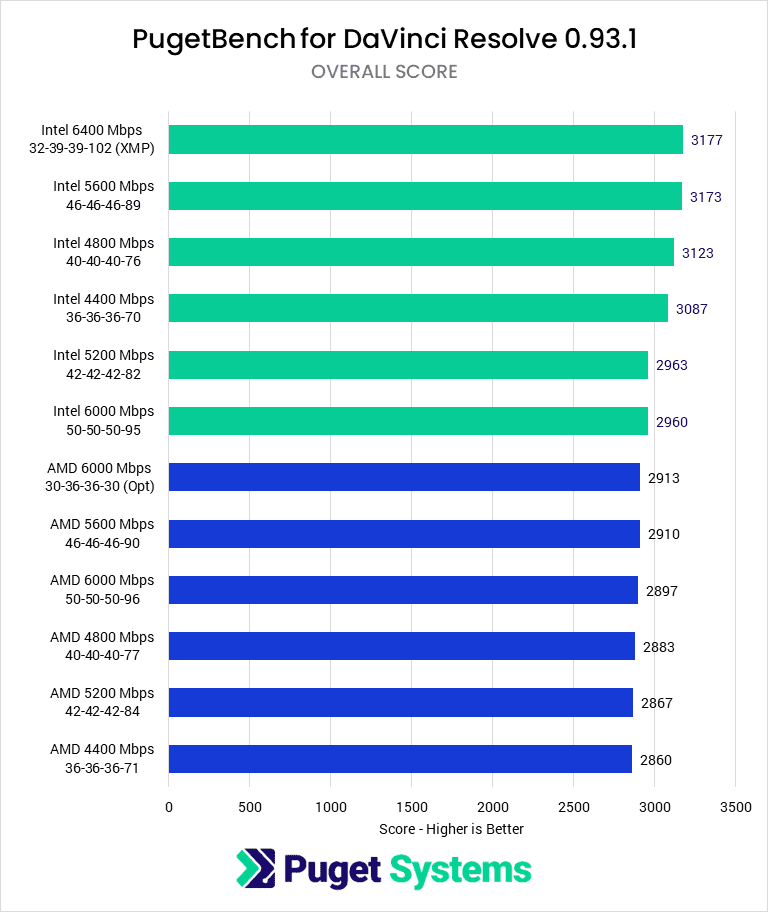
DaVinci Resolve Overall Score - Higher is Better. Intel 6400 (XMP): 3177; Intel 5600: 3173; Intel 4800: 3123; Intel 4400: 3087; Intel 5200: 2963; Intel 6000: 2960; AMD 6000 (Optimized): 2913; AMD 5600: 2913; AMD 6000 (JEDEC): 2897; AMD 4800: 2883; AMD 5200: 2867; AMD 4400: 2860
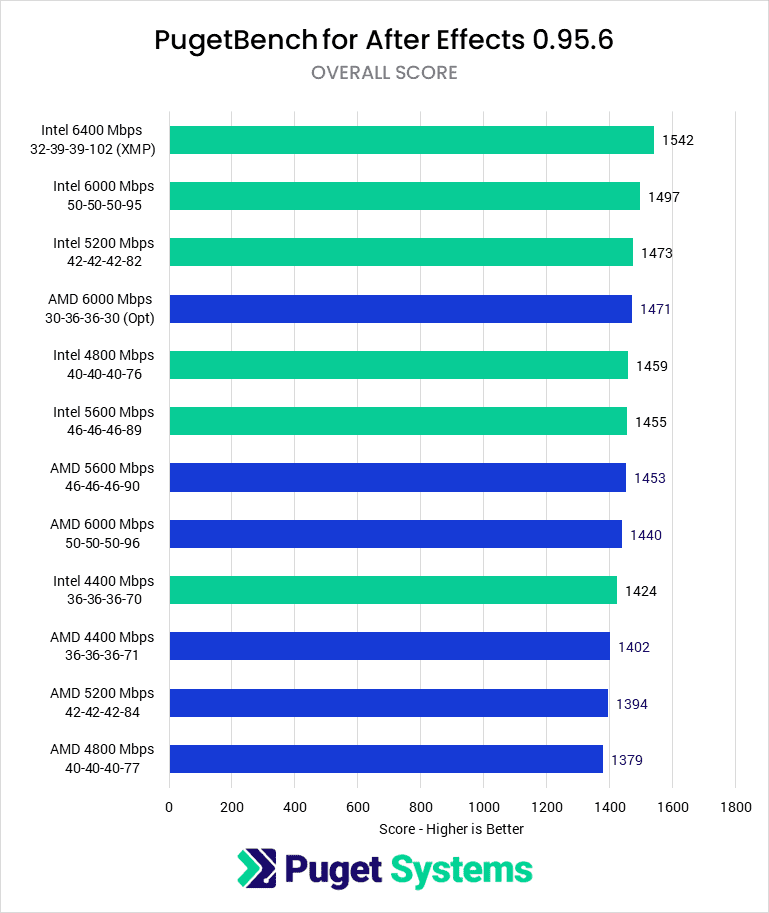
After Effects Overall Score - Higher is Better. Intel 6400 (XMP): 1542; Intel 6000: 1497; Intel 5200: 1473; AMD 6000 (Optimized): 1471; Intel 4800: 1459; Intel 5600: 1455; AMD 5600: 1453; AMD 6000 (JEDEC): 1440; Intel 4400: 1424; AMD 4400: 1402; AMD 5200: 1394; AMD 4800: 1379
Previous Next
System Image
Premiere Pro Extended Overall Score - Higher is Better. Intel 6400 (XMP): 1621; Intel 6000: 1601; Intel 5600: 1509; Intel 5200: 1486; Intel 4800: 1473; Intel 4400: 1428; AMD 6000 (Optimized): 1200; AMD 6000 (JEDEC): 1153; AMD 5600: 1149; AMD 5200: 1134; AMD 4800: 1121; AMD 4400: 1114
Open Full Resolution
DaVinci Resolve Overall Score - Higher is Better. Intel 6400 (XMP): 3177; Intel 5600: 3173; Intel 4800: 3123; Intel 4400: 3087; Intel 5200: 2963; Intel 6000: 2960; AMD 6000 (Optimized): 2913; AMD 5600: 2913; AMD 6000 (JEDEC): 2897; AMD 4800: 2883; AMD 5200: 2867; AMD 4400: 2860
Open Full Resolution
After Effects Overall Score - Higher is Better. Intel 6400 (XMP): 1542; Intel 6000: 1497; Intel 5200: 1473; AMD 6000 (Optimized): 1471; Intel 4800: 1459; Intel 5600: 1455; AMD 5600: 1453; AMD 6000 (JEDEC): 1440; Intel 4400: 1424; AMD 4400: 1402; AMD 5200: 1394; AMD 4800: 1379
Open Full Resolution
Previous Next

Video editing and motion graphics performance is interesting compared to photography in that two of the applications – DaVinci Resolve and After Effects – appear less sensitive to memory than Premiere Pro or the Photography applications. DaVinci Resolve, for both Intel- and AMD-based systems, shows little correlation between performance and RAM speed and has a low spread of scores, just a few percent. After Effects shows some relatively consistent performance scaling with RAM speed but with a similarly small total difference of about 7% from worst to best.

Premiere Pro once again splits our platforms, with the AMD system showing little change overall with memory frequency, but seeing a measurable, if still relatively small, benefit from the tests with more optimized timings. The Intel platform, meanwhile, has a 13% change from slowest memory to fastest.

Game Development and Virtual Production

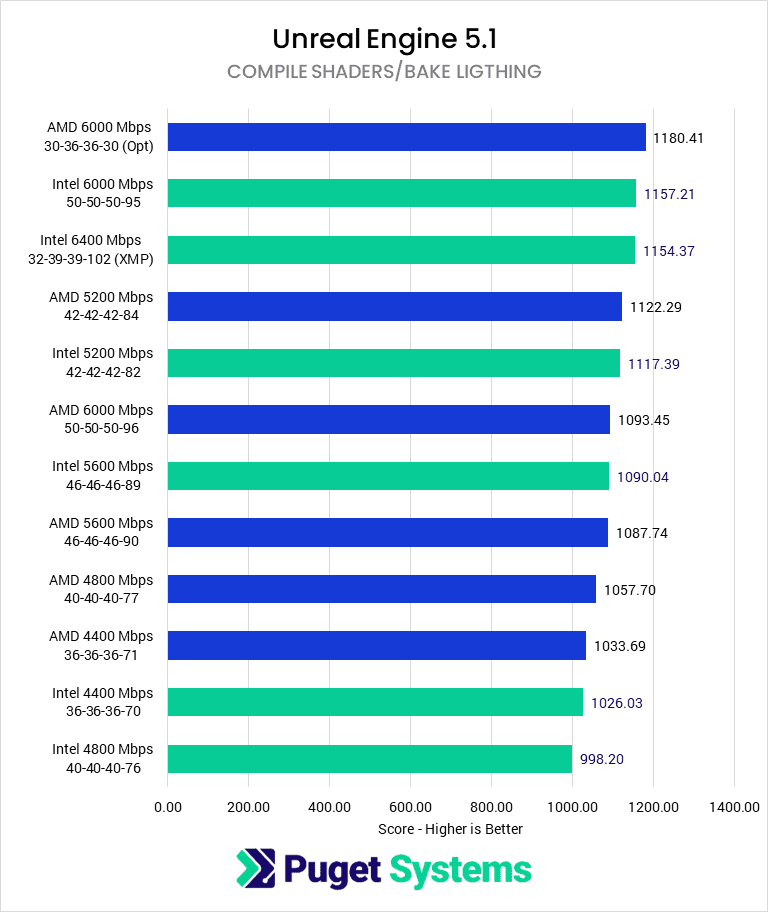
Unreal Engine 5.1 Compile Shaders and Bake Lighting Score - Higher is Better. AMD 6000 (Optimized): 1180.41; Intel 6000: 1157.21; Intel 6400 (XMP): 1154.37; AMD 5200: 1122.29; Intel 5200: 1117.39; AMD 6000 (JEDEC): 1093.45; Intel 5600: 1090.04; AMD 5600: 1087.74; AMD 4800: 1057.70; AMD 4400: 1033.69; Intel 4400: 1026; Intel 4800: 998.20
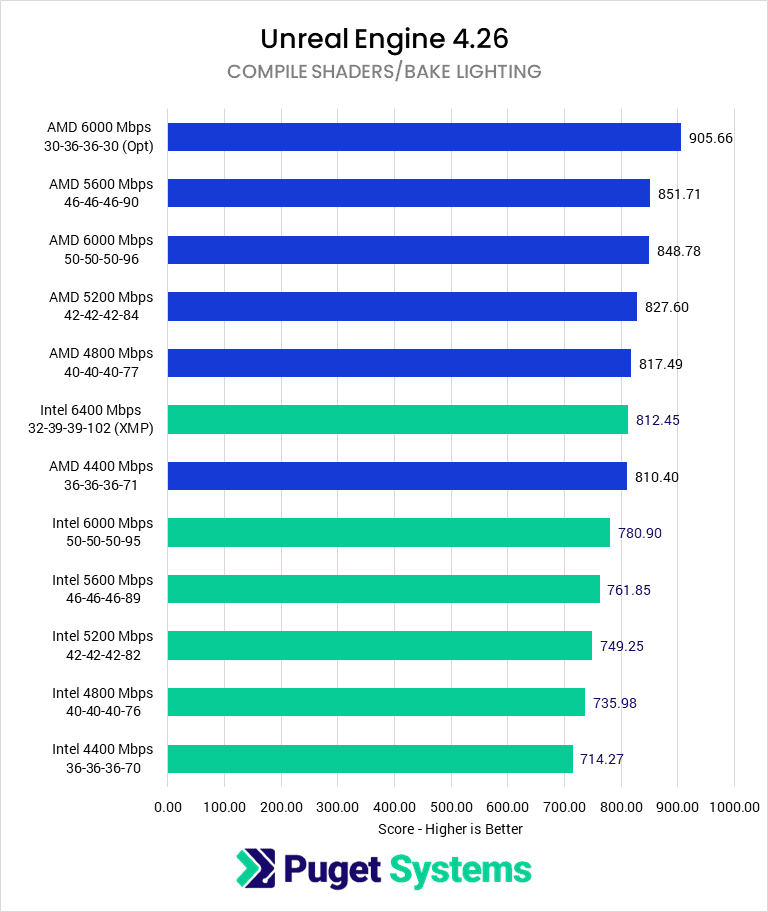
Unreal Engine 4.26 Compile Shaders and Bake Lighting Score - Higher is Better. AMD 6000 (Optimized): 905.66; AMD 5600: 851.71; AMD 6000 (JEDEC): 848.78; AMD 5200: 827.60; AMD 4800: 817.49; Intel 6400 (XMP): 812.45; AMD 4400: 810.40; Intel 6000: 780.90; Intel 5600: 761.85; Intel 5200: 749.25; Intel 4800: 735.98; Intel 4400: 714.27
Previous Next
System Image
Unreal Engine 5.1 Compile Shaders and Bake Lighting Score - Higher is Better. AMD 6000 (Optimized): 1180.41; Intel 6000: 1157.21; Intel 6400 (XMP): 1154.37; AMD 5200: 1122.29; Intel 5200: 1117.39; AMD 6000 (JEDEC): 1093.45; Intel 5600: 1090.04; AMD 5600: 1087.74; AMD 4800: 1057.70; AMD 4400: 1033.69; Intel 4400: 1026; Intel 4800: 998.20
Open Full Resolution
Unreal Engine 4.26 Compile Shaders and Bake Lighting Score - Higher is Better. AMD 6000 (Optimized): 905.66; AMD 5600: 851.71; AMD 6000 (JEDEC): 848.78; AMD 5200: 827.60; AMD 4800: 817.49; Intel 6400 (XMP): 812.45; AMD 4400: 810.40; Intel 6000: 780.90; Intel 5600: 761.85; Intel 5200: 749.25; Intel 4800: 735.98; Intel 4400: 714.27
Open Full Resolution
Previous Next

Although many of the tasks in the Unreal Engine benchmarks we run for CPUs are best suited to a higher-end processor like a Threadripper Pro, it is interesting that this is the first benchmark we’ve seen where the differences in RAM speed could reasonably change which processor seems the best option for the workflow; at least for Unreal Engine 5.1. Overall, Unreal Engine benchmarks appear to be the most sensitive to memory frequency and latency, with an average performance delta of 12% across both Intel and AMD platforms.

If there was a place to be concerned about a system’s RAM – beyond capacity – Unreal Engine tasks are probably it, especially on AMD, where reducing RAM latencies at 6000 Mbps caused an 8% performance increase.

Rendering

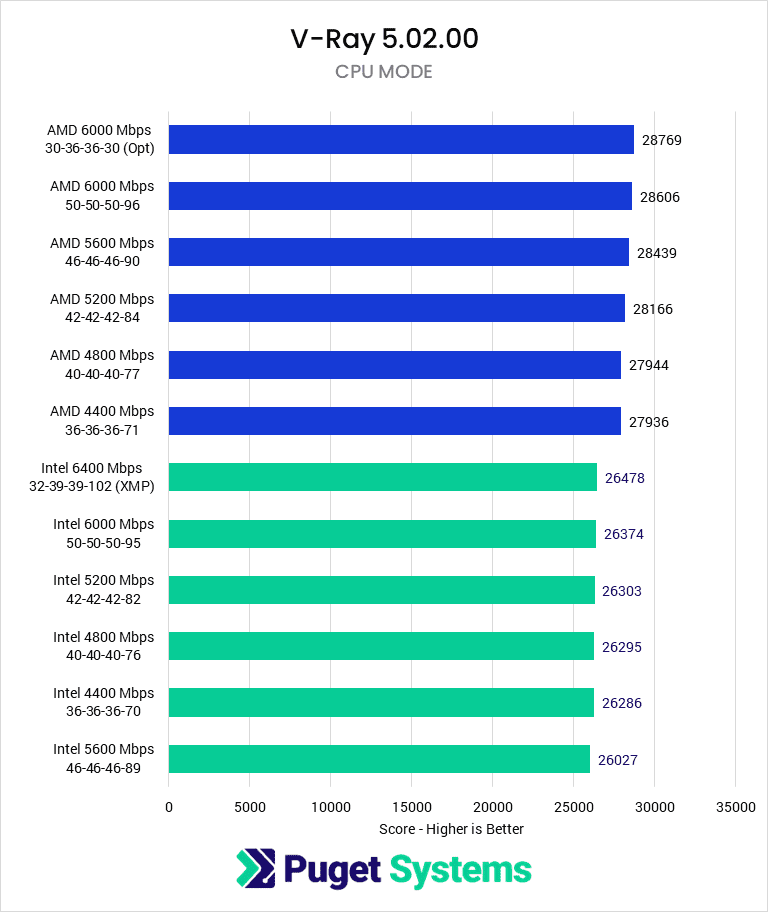
V-Ray CPU Render Score - Higher is Better. AMD 6000 (Optimized): 28769; AMD 6000 (JEDEC): 28606; AMD 5600: 28439; AMD 5200: 28166; AMD 4800: 27944; AMD 4400: 27936; Intel 6400 (XMP): 26478; Intel 6000: 26374; Intel 5200: 26303; Intel 4800: 26295; Intel 4400: 26286; Intel 5600: 26027
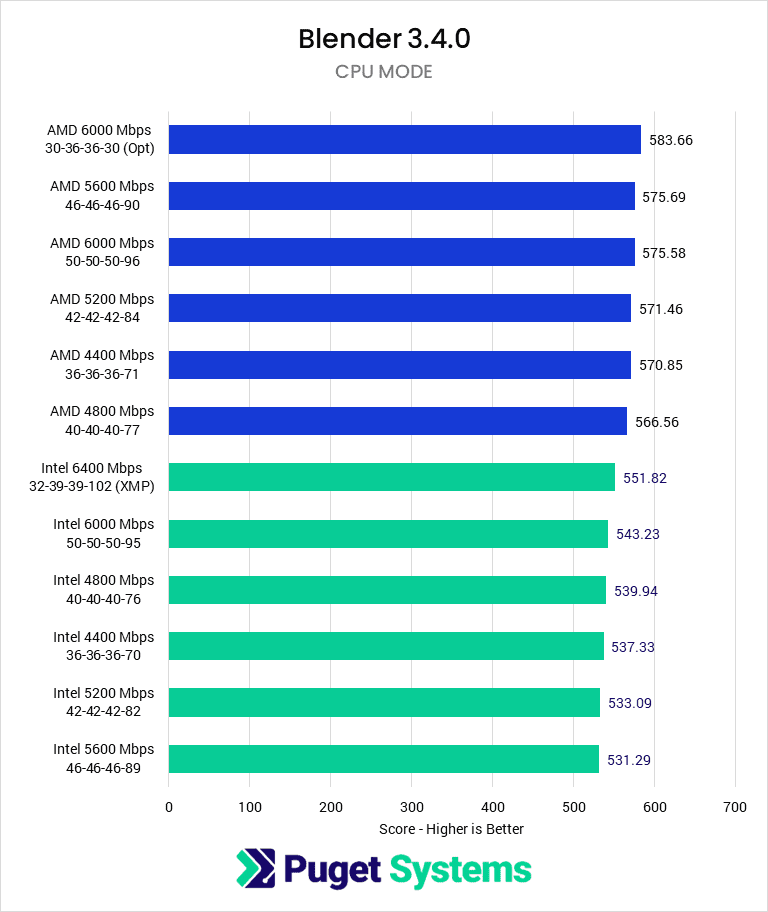
Blender CPU Render Score - Higher is Better. AMD 6000 (Optimized): 583.66; AMD 5600: 575.69; AMD 6000 (JEDEC): 575.58; AMD 5200: 571.46; AMD 4400: 570.85; AMD 4800: 566.56; Intel 6400 (XMP): 551.82; Intel 6000: 543.23; Intel 4800: 539.94; Intel 4400: 537.33; Intel 5200: 533.09; Intel 5600: 531.29
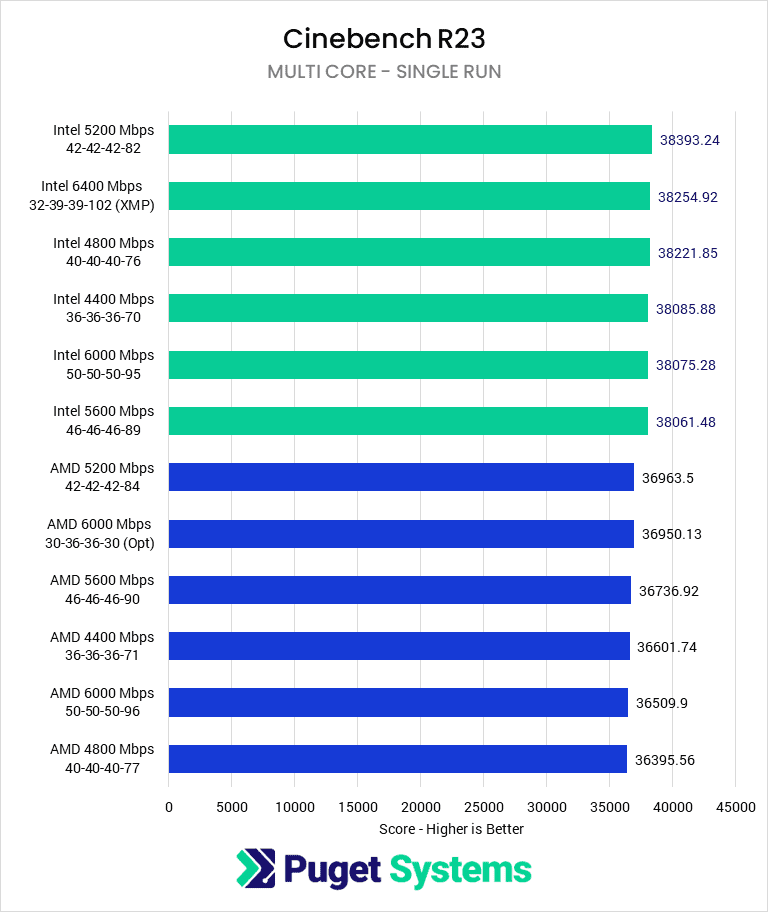
Cinebench All-Core CPU Render Score - Higher is Better. Intel 5200: 38393.24; Intel 6400 (XMP): 38254.92; Intel 4800: 38221.85; Intel 4400: 38085.88; Intel 6000: 38075.28; Intel 5600: 38061.48; AMD 5200: 36963.5; AMD 6000 (Optimized): 36950.13; AMD 5600: 36736.92; AMD 4400: 36601.74; AMD 6000 (JEDEC): 36509.9; AMD 4800: 36395.56
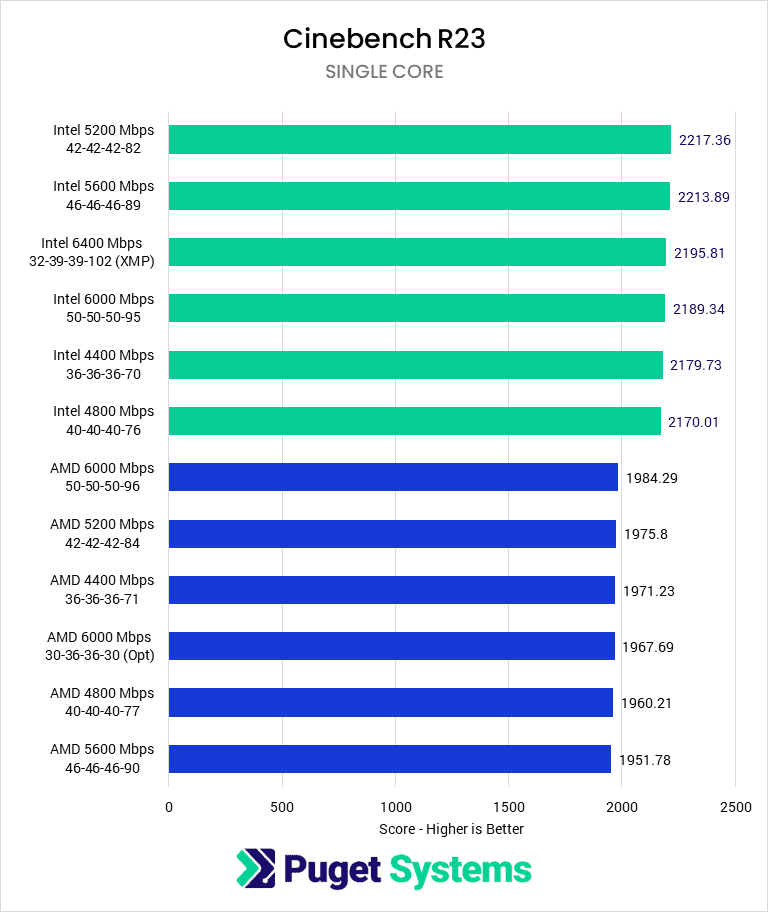
Cinebench Single-Core CPU Render Score - Higher is Better. Intel 5200: 2217.36; Intel 5600: 2213.89; Intel 6400 (XMP): 2195.81; Intel 6000: 2189.34; Intel 4400: 2179.73; Intel 4800: 2170.01; AMD 6000: 1984.29; AMD 5200: 1975.8; AMD 4400: 1971.23; AMD 6000 (Optimized): 1967.69; AMD 4800: 1960.21; AMD 5600: 1951.78
Previous Next
System Image
V-Ray CPU Render Score - Higher is Better. AMD 6000 (Optimized): 28769; AMD 6000 (JEDEC): 28606; AMD 5600: 28439; AMD 5200: 28166; AMD 4800: 27944; AMD 4400: 27936; Intel 6400 (XMP): 26478; Intel 6000: 26374; Intel 5200: 26303; Intel 4800: 26295; Intel 4400: 26286; Intel 5600: 26027
Open Full Resolution
Blender CPU Render Score - Higher is Better. AMD 6000 (Optimized): 583.66; AMD 5600: 575.69; AMD 6000 (JEDEC): 575.58; AMD 5200: 571.46; AMD 4400: 570.85; AMD 4800: 566.56; Intel 6400 (XMP): 551.82; Intel 6000: 543.23; Intel 4800: 539.94; Intel 4400: 537.33; Intel 5200: 533.09; Intel 5600: 531.29
Open Full Resolution
Cinebench All-Core CPU Render Score - Higher is Better. Intel 5200: 38393.24; Intel 6400 (XMP): 38254.92; Intel 4800: 38221.85; Intel 4400: 38085.88; Intel 6000: 38075.28; Intel 5600: 38061.48; AMD 5200: 36963.5; AMD 6000 (Optimized): 36950.13; AMD 5600: 36736.92; AMD 4400: 36601.74; AMD 6000 (JEDEC): 36509.9; AMD 4800: 36395.56
Open Full Resolution
Cinebench Single-Core CPU Render Score - Higher is Better. Intel 5200: 2217.36; Intel 5600: 2213.89; Intel 6400 (XMP): 2195.81; Intel 6000: 2189.34; Intel 4400: 2179.73; Intel 4800: 2170.01; AMD 6000: 1984.29; AMD 5200: 1975.8; AMD 4400: 1971.23; AMD 6000 (Optimized): 1967.69; AMD 4800: 1960.21; AMD 5600: 1951.78
Open Full Resolution
Previous Next

CPU Rendering tends to care primarily for cores, core frequency, and instructions per clock cycle; in other words, it really only cares about the CPU. We see, then, that memory frequency has no significant effect on rendering performance: the largest difference is for AMD platforms in V-Ray, a mere 3% total performance difference, which is even then hardly beyond run-to-run variance. The Blender benchmark shows even less performance gain with memory, while the Cinebench R23 benchmarks are all within the margin of error.

Overall Performance

To examine the overall performance impact of DDR5 memory frequency/timings, we normalized scores to the highest officially supported speeds – 5600 Mbps for Intel and 5200 Mbps for AMD, and then computed a weighted geometric mean of the normalized scores by and across categories – these can essentially be considered performance percentage ratios:

Normalized ScoresIntel 4400 Mbps
36-36-36-70
Intel 4800 Mbps
40-40-40-76
Intel 5200 Mbps
42-42-42-82
Intel 5600 Mbps
46-46-46-89
Intel 6000 Mbps
50-50-50-95
Intel 6400 Mbps
32-39-39-102 (XMP)
Photography95.6897.42100.15100100.25102.85
Video Editing96.5998.7697.64100100.61104.46
Game Dev93.9494.06100.41100104.32106.27
Rendering100.90101.12100.95100101.41102.18
Overall Score96.7497.8199.78100101.63103.93
Normalized ScoresAMD 4400 Mbps
36-36-36-71
AMD 4800 Mbps
40-40-40-77
AMD 5200 Mbps
42-42-42-84
AMD 5600 Mbps
46-46-46-90
AMD 6000 Mbps
50-50-50-96
AMD 6000 Mbps
30-36-36-30
Photography95.0498.92100101.55100.87104.71
Video Editing99.5299.44100102.34102104.30
Game Dev94.9796.4510099.8499.96107.28
Rendering99.5399.12100100.31100.68101.28
Overall Score97.4998.48100101.01100.84104.37

Overall, we see that the Intel platform had a performance difference of 7% from 4400 Mbps to the 6400 Mbps XMP profile, while the AMD platform had a slightly more significant performance difference of 10%. From their max supported frequencies, these were 4% overall.

Game Development and Virtual Production were the most sensitive to memory frequency/timings, followed by Photography and Video Editing/Motion Graphics. Rendering was relatively unaffected by memory. While a performance increase of about 5% is a measurable change, it is relatively small compared to the difference in performance when changing or upgrading other primary components such as CPUs or GPUs.

Tower Computer Icon in Puget Systems Colors

Looking for a Content Creation Workstation?

We build computers tailor-made for your workflow. 

Configure a System!
Talking Head Icon in Puget Systems Colors

Don’t know where to start?
We can help!

Get in touch with our technical consultants today.

Talk to an Expert

How Does DDR5 Memory Speed Affect Content Creation Performance?

While increasing DDR5 memory frequency does positively affect performance on both the Intel i9-13900K and AMD Ryzen 9 7950X, the overall gains were relatively small, especially as the frequency was raised beyond the maximum supported memory frequencies of the processors. As we observed above, going outside those frequencies resulted in a performance gain of just 5-7%, with the most benefit to our Unreal Engine benchmarks and virtually none to our Rendering benchmarks.

However, the tradeoff for that increased performance is the potential for decreased system stability. In our experience, attempting to push higher frequencies and lower timings can result in a higher likelihood of Windows BSODs and applications crashing. A great example is what we saw when using the DDR5-6400 RAM on AMD. Although we have seen others use that fast of memory – you can even buy AMD EXPO kits for it – we couldn’t get it to work while running any content creation applications. While this is acceptable for many enthusiasts, as they are more willing to tinker with timings and voltages to get to a point of sufficient stability, as workstation manufacturers, it is not something we can endorse right now if you need your system to be a reliable part of your workflow.

What this testing has solidified for us is that if you are looking for the best mix of performance and stability, using RAM that matches the CPU manufacturer’s specifications is probably the right way to go. And to be clear, we are talking about the officially supported RAM speeds, not any of their “optimized for best performance” recommendations.

When it comes to finding the ideal workstation for nearly any application, Puget Systems has you covered. Explore our solutions page, where we have curated a collection of workstations tailor-made for various uses from Premiere Pro to Machine Learning/AI. If your needs are more unique, we offer a custom configuration page, allowing you to design a workstation precisely tailored to your requirements. If you’re unsure about the intricate details of configuring a workstation that suits your workflow, don’t hesitate to reach out to our team of technology consultants. They are ready and eager to provide the assistance you need.

Tower Computer Icon in Puget Systems Colors

Looking for a content creation workstation?

We build computers tailor-made for your workflow. 

Configure a System
Talking Head Icon in Puget Systems Colors

Don’t know where to start?
We can help!

Get in touch with one of our technical consultants today.

Talk to an Expert

Related Content

  • Z890 vs. B860 vs. H810
  • AMD Ryzen 9 9950X3D and 9900X3D Content Creation Review
  • Is it Worth Upgrading to NVIDIA’s GeForce RTX 50 Series for 3D Artists?
View All Related Content

Latest Content

  • Do Video Editors Need GeForce RTX 50 Series GPUs?
  • Adobe Premiere Pro and After Effects – What’s New In Version 25.2?
  • The Future of LED Walls: Arena & Nuke Stage Go Beyond Game Engines
  • 2025 Tariff Impacts at Puget Systems
View All
Tags: 7950X, After Effects, AMD, Blender, Cinebench, DaVinci Resolve, i9 13900K, Intel, Lightroom CLassic, Memory, Photoshop, Premiere Pro, Unreal Engine, V-Ray

Who is Puget Systems?

Puget Systems builds custom workstations, servers and storage solutions tailored for your work.

We provide:

Extensive performance testing
making you more productive and giving better value for your money

Reliable computers
with fewer crashes means more time working & less time waiting

Support that understands
your complex workflows and can get you back up & running ASAP

A proven track record
as shown by our case studies and customer testimonials

Get Started

Browse Systems

Puget Systems Mobile Laptop Workstation Icon

Mobile

Puget Systems Tower Workstation Icon

Workstations

Puget Systems Rackmount Workstation Icon

Rackstations

Puget Systems Rackmount Server Icon

Servers

Puget Systems Rackmount Storage Icon

Storage

Latest Articles

  • Do Video Editors Need GeForce RTX 50 Series GPUs?
  • Adobe Premiere Pro and After Effects – What’s New In Version 25.2?
  • The Future of LED Walls: Arena & Nuke Stage Go Beyond Game Engines
  • 2025 Tariff Impacts at Puget Systems
  • Z890 vs. B860 vs. H810
View All

Post navigation

 NVIDIA RTX 4070 and 4060 Ti (8GB) Content Creation ReviewAMD Radeon PRO W7800 and W7900 Content Creation Review 
Puget Systems Logo
Build Your Own PC Site Map FAQ
facebook instagram linkedin rss twitter youtube

Optimized Solutions

  • Adobe Premiere
  • Adobe Photoshop
  • Solidworks
  • Autodesk AutoCAD
  • Machine Learning

Workstations

  • Content Creation
  • Engineering
  • Scientific PCs
  • More

Support

  • Online Guides
  • Request Support
  • Remote Help

Publications

  • All News
  • Puget Blog
  • HPC Blog
  • Hardware Articles
  • Case Studies

Policies

  • Warranty & Return
  • Terms and Conditions
  • Privacy Policy
  • Delivery Times
  • Accessibility

About Us

  • Testimonials
  • Careers
  • About Us
  • Contact Us
  • Newsletter

© Copyright 2025 - Puget Systems, All Rights Reserved.